Google Charts with PHP: Basic Setup and Pie Chart
Current setup: load once, draw after the library is ready
Load the Google Charts library once, request the package you need, and draw into a dedicated container after the loader callback fires.
<div id="chart_div" style="width:100%;min-height:380px"></div>
<script src="https://www.gstatic.com/charts/loader.js"></script>
<script>
google.charts.load('current', {packages: ['corechart']});
google.charts.setOnLoadCallback(drawChart);

function drawChart() {
  const data = google.visualization.arrayToDataTable([
    ['Language', 'Tutorials'],
    ['PHP', 300],
    ['MySQL', 100],
    ['JavaScript', 200]
  ]);
  const chart = new google.visualization.PieChart(document.getElementById('chart_div'));
  chart.draw(data, {title: 'Tutorial distribution'});
}
</script>
Google Chart tool to display Pie chart with data and different options using loader.js library
HTML
This part is included in above code<div id="chart_div"></div>Changing Height Width and Title
var options = {'title':'Tutorials at plus2net.com',
                       'width':400,
                       'height':300};
3-D Pie chart
Change the options and addis3D=true, by default its value is false.
var options = {title:'plus2net.com :Nos of tutorials',
           width:600,
           height:500,
	   legend:'left',
           is3D:true};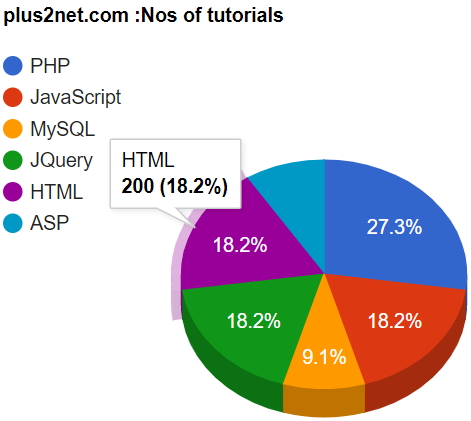
Data Source
Our data source can be from Comma Separated Value ( CSV ) file or from MySQL database. We use one array variable in PHP where we collect the data first. This array is created by taking data from different sources. After creating this array, the rest of the code to generate the graph remain same.In all tutorials we maintained the same sequence so created the php array
$php_data_array first and then transfer the data to JavaScript array my_2d to create the graph.
Creating image from the graph
This is applicable to all types of graphs. Below code will generate one .png file which can be downloaded.var chart_div = document.getElementById('chart_div');
var chart = new google.visualization.PieChart(chart_div);
google.visualization.events.addListener(chart, 'ready', function () {
chart_div.innerHTML = '<img src="' + chart.getImageURI() + '">';
console.log(chart_div.innerHTML);
});
chart.draw(data, options);3D Pie Chart with change in data Understanding different types of Charts
Pie Chart with Data from MySQL database table Tutorial on using MySQL records to display in Google table chart.

Subhendu Mohapatra
Author & Instructor at plus2net
I write and maintain practical tutorials on Python, PHP, SQL, JavaScript, HTML, jQuery, and web development at plus2net. The tutorials focus on clear explanations, working examples, and code that readers can test and adapt while learning.
Connect:


Subscribe to our YouTube Channel here
This article is written by plus2net.com team.
https://www.plus2net.com