Using shapes like Circles & rectangles to PDF file
PDF pages in Python to add shapes like circles with random colour fills using ReportLab drawing.
Circles can be drawn by specifying centre X , Y coordinates and by giving radios. We can also specify the colour to be used to fill the circle. Here two circles are drawn with two different background-colors.
With two alternate coloured circles

from reportlab.graphics.shapes import *
my_path='G:\\My drive\\testing\\pypdf2\\my_pdf.pdf'
d=Drawing(600,600)
import random
for rd in range(0,300,10):
    if(rd%20==0):
        d.add(Circle(300,300,300-rd,fillColor=[1,0,0]))
    else:
        d.add(Circle(300,300,300-rd,fillColor=[0,1,0]))
from reportlab.graphics import renderPDF
renderPDF.drawToFile(d,my_path,'')
Raondom Multi coloured concentric circles
We can generate float between 0 and less than 1 ( exclusive ) by using random.random().random.uniform() returns between start and stop ( inclusive )
More about Random numbers

from reportlab.graphics.shapes import *
my_path='G:\\My drive\\testing\\pypdf2\\my_pdf.pdf'
d=Drawing(1200,1200)
import random
for rd in range(0,600,20):
    r=random.random()
    g=random.random()
    b=random.random()
    d.add(Circle(600,600,600-rd,fillColor=[r,g,b]))

from reportlab.graphics import renderPDF
renderPDF.drawToFile(d,my_path,'')
Drawing random colour filled rectangles
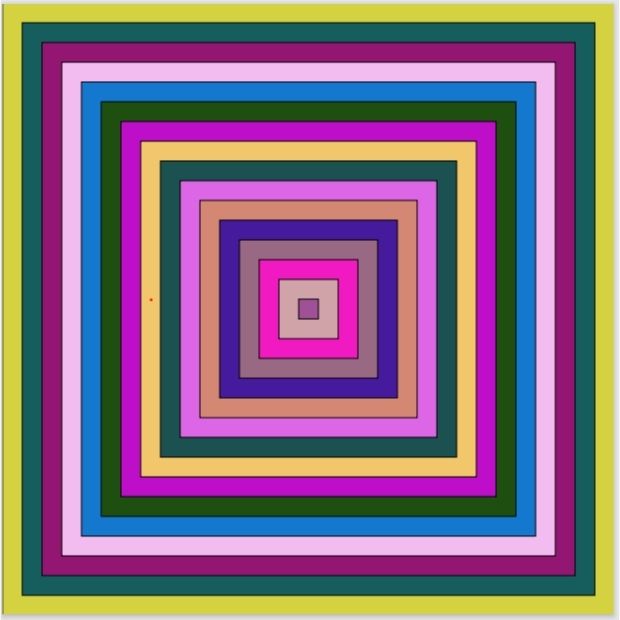
Here we have used random.uniform() to generate random floats between 0 and 1 (inclusive of 0 and 1). Check this link for difference between random.uniform() and random.random()
More about Random numbers
Here width and height is set to to variables. So it can easily increased or decresed at single point.
w,h=620,620from reportlab.graphics.shapes import *
my_path='G:\\My drive\\testing\\pypdf2\\my_pdf.pdf'
w,h=620,620
d = Drawing(w,h)
import random
for rd in range(0,int(w/2),20):
r=random.uniform(0,1)
g=random.uniform(0,1)
b=random.uniform(0,1)
d.add(Rect(rd, rd, w-(rd*2), h-(rd*2), fillColor=[r,g,b]))
from reportlab.graphics import renderPDF
renderPDF.drawToFile(d, my_path, '')Python PDF Bar charts in PDF Line charts in PDF Pie Charts Paragraph
PDF Mark sheet by using data from SQLite database
Create Report in PDF using Charts, images, tables and Paragraphs

Subhendu Mohapatra
Author & Instructor at plus2net
I write and maintain practical tutorials on Python, PHP, SQL, JavaScript, HTML, jQuery, and web development at plus2net. The tutorials focus on clear explanations, working examples, and code that readers can test and adapt while learning.
Connect:


Subscribe to our YouTube Channel here
This article is written by plus2net.com team.
https://www.plus2net.com

 Python Video Tutorials