Pandas DataFrame Plotting: The Complete Visualization Guide
The DataFrame.plot accessor connects the analytical speed of Pandas with the rendering power of Matplotlib. Whether you need to track time-series trends, compare category leaderboards, inspect statistical distributions, or map bivariate correlations across millions of records, Pandas provides a unified, intuitive charting syntax. This pillar page serves as the master guide to the entire Pandas plotting ecosystem.
How Pandas Plotting Works: The .plot Accessor 🔝
Pandas offers two equivalent syntaxes for generating charts from any DataFrame or Series:
- Method Accessor:
df.plot.line(),df.plot.bar(),df.plot.scatter()(Provides parameter tab-completion in modern IDEs). - Kind Argument:
df.plot(kind="line"),df.plot(kind="bar")(Enables programmatic chart type switching).
Every call returns a Matplotlib AxesSubplot object, allowing you to seamlessly customize titles, labels, limits, and legends using standard Matplotlib functions.
Visualization Decision Matrix: Choosing the Right Chart 🔝
Selecting the optimal chart depends directly on your analytical objective and data structure:
| Analytical Goal | Best Chart Format | Pandas Method | Typical Use Case |
|---|---|---|---|
| Trend over Time / Progression | Line Chart | df.plot.line() | Stock prices, server metrics, revenue over months. |
| Category Comparison | Bar Chart | df.plot.bar() | Regional sales, department headcounts. |
| Rankings & Long Labels | Horizontal Bar | df.plot.barh() | Top 10 customer leaderboards, product rankings. |
| Relative Proportions | Pie Chart | df.plot.pie() | Market share, expense allocations (5 or fewer items). |
| Cumulative Totals over Time | Area Plot | df.plot.area() | Multi-channel revenue accumulation, server bandwidth. |
| Frequency Distribution | Histogram | df.plot.hist() | Customer age spread, order value distribution bins. |
| Five-Number Summary & Outliers | Box Plot | df.plot.box() | Salary disparities across departments, test scores. |
| Continuous Probability Density | Density (KDE) | df.plot.density() | Smooth distribution curves without histogram bin bias. |
| Two-Variable Correlation | Scatter Plot | df.plot.scatter() | Advertising spend vs sales revenue, height vs weight. |
| Large Bivariate Datasets (10k+) | Hexbin Plot | df.plot.hexbin() | 2D point clouds solving scatter overplotting. |
| Database Direct Visualization | SQL Integration | pd.read_sql() | Extracting and charting records directly from MySQL. |
Explore the Plotting Topic Cluster 🔝
Deep-dive into each specialized visualization tutorial with comprehensive parameters, real-world datasets, and interactive Colab notebooks:

Line Charts
Visualize continuous trends, multi-line comparisons, secondary axes, and markers over ordered axes.
Explore Line Charts »
Bar Charts
Compare category metrics, configure grouped columns, multi-metric bars, and color palettes.
Explore Bar Charts »
Horizontal Bar Charts
Ideal for leaderboards, rank sorting, stacked comparisons, and handling long category labels.
Explore Horizontal Bars »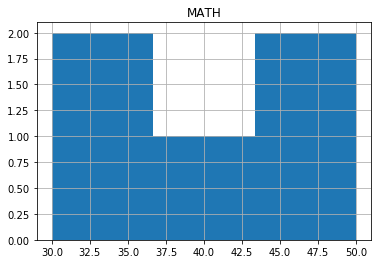
Histograms
Analyze continuous distributions, custom bin intervals, alpha transparency, and cumulative frequencies.
Explore Histograms »
Box Plots
Evaluate five-number statistical summaries, detect outliers, and compare groups with by.

Pie Charts
Illustrate proportional shares of categorical totals with percentage callouts and shadow effects.
Explore Pie Charts »
Density (KDE) Plots
Smooth probability density estimates (PDF) with bandwidth tuning and line styles.
Explore Density Plots »
Area Plots
Show cumulative volume progression, compare stacked vs unstacked layers with alpha transparency.
Explore Area Plots »
Scatter Plots
Explore bivariate numeric correlations, color-coded categories, and 3D bubble chart sizing.
Explore Scatter Plots »
Hexbin Plots
Resolve scatter overplotting across dense datasets with 2D hexagonal binning and log colorbars.
Explore Hexbin Plots »Plotting from MySQL
Extract aggregated database records using SQLAlchemy and render charts directly from SQL queries.
Explore MySQL Plotting »Plotting Exercises & Solutions
Test your charting skills with real-world problems, data transformations, and interactive solutions.
Start Exercises »Common Global Parameters Reference 🔝
Most Pandas plot methods accept a universal suite of styling and layout parameters:
figsize=(width, height): Size of the figure in inches (e.g.figsize=(8, 4)).title="Title Text": Header string displayed above the plot.grid=True / False: Show or hide background reference gridlines.rot=degrees: Angle of rotation for X-axis tick labels (e.g.rot=45).fontsize=integer: Base font size for tick labels and legends.colormap="name": Matplotlib colormap string (e.g."viridis","plasma","Blues").subplots=True: Automatically split columns into separate individual subplots.ax=axes: Direct output into an existing Matplotlib subplot Axes.
Building Subplot Dashboards 🔝
Combine multiple complementary chart formats onto a unified analytical canvas using Matplotlib's plt.subplots():
import pandas as pd
import matplotlib.pyplot as plt

data = {
    "Month": ["Jan", "Feb", "Mar", "Apr", "May"],
    "Revenue": [12000, 15000, 14000, 18000, 21000],
    "Expenses": [8000, 9500, 8700, 11000, 12500]
}
df = pd.DataFrame(data)

# Create 1 row, 2 columns dashboard
fig, axes = plt.subplots(1, 2, figsize=(10, 4))

df.plot.line(x="Month", y=["Revenue", "Expenses"], marker="o", ax=axes[0], title="Financial Trends")
df.plot.bar(x="Month", y="Revenue", color="#2b5c8f", ax=axes[1], title="Monthly Revenue")

plt.tight_layout()
plt.show()
High-Resolution Image Export with savefig() 🔝
Save any generated visualization to high-resolution PNG, PDF, or SVG files for enterprise presentations:
ax = df.plot.line(x="Month", y="Revenue", figsize=(7, 4))
plt.title("Q1-Q2 Executive Revenue Trajectory")
plt.tight_layout()
plt.savefig("executive_revenue.png", dpi=300, bbox_inches="tight")
plt.close()
print("Exported executive_revenue.png successfully!")
Practical workflow: executive multi-chart sales analytics 🔝
In retail business intelligence, executives require multi-faceted visibility into total revenues, regional breakdowns, and product distribution. Here is a production-grade 4-panel dashboard script:
import pandas as pd
import numpy as np
import matplotlib.pyplot as plt

np.random.seed(42)
months = [f"2026-{m:02d}" for m in range(1, 7)]
sales_north = [45000, 48000, 52000, 58000, 61000, 67000]
sales_south = [32000, 34000, 37000, 39000, 44000, 48000]

df_sales = pd.DataFrame({
    "Month": months,
    "North_Region": sales_north,
    "South_Region": sales_south
})
df_sales["Total_Sales"] = df_sales["North_Region"] + df_sales["South_Region"]

print(df_sales)
assert df_sales["Total_Sales"].iloc[-1] == 115000

# 4-Chart Executive Canvas
fig, axes = plt.subplots(2, 2, figsize=(11, 8))

# 1. Total trajectory line
df_sales.plot.line(x="Month", y="Total_Sales", marker="s", color="#1f77b4", ax=axes[0, 0], title="Total Monthly Revenue")

# 2. Regional comparison bars
df_sales.plot.bar(x="Month", y=["North_Region", "South_Region"], ax=axes[0, 1], title="Regional Performance")

# 3. Stacked volume accumulation
df_sales.plot.area(x="Month", y=["South_Region", "North_Region"], alpha=0.6, ax=axes[1, 0], title="Cumulative Volume")

# 4. Regional share breakdown
total_by_region = pd.Series({
    "North": df_sales["North_Region"].sum(),
    "South": df_sales["South_Region"].sum()
})
total_by_region.plot.pie(autopct="%1.1f%%", ax=axes[1, 1], title="H1 Regional Share")
axes[1, 1].set_ylabel("")

plt.tight_layout()
plt.show()
Expected console output:
     Month  North_Region  South_Region  Total_Sales
0  2026-01         45000         32000        77000
1  2026-02         48000         34000        82000
2  2026-03         52000         37000        89000
3  2026-04         58000         39000        97000
4  2026-05         61000         44000       105000
5  2026-06         67000         48000       115000
Practice in Google Colab 🔝
Execute and explore the entire suite of Pandas chart formats in our comprehensive Google Colab master practice notebook:
Open in Google Colab View on GitHub
Execute and explore the entire suite of Pandas chart formats, multi-panel subplot canvases, and export workflows directly in Google Colab. All sample datasets are embedded directly in the master practice notebook.
Further Reading & Related Tutorials 🔝
- Pandas DataFrame Home — Core data structures, attributes, and slicing methods.
- Pandas Data Analysis — Aggregations, statistical metrics, and data summaries.
- Pandas Data Cleaning — Handling null values, deduplication, and data types.
- Pandas Datetime Operations — Resampling, time-series offsets, and date ranges.
- Pandas Real-World Projects — Complete case studies and practical data workflows.
- Pandas Section Home — Master index of all Pandas pillars, tutorials, and guides.
Reference: Pandas DataFrame.plot official documentation.

Subhendu Mohapatra
Author & Instructor at plus2net
I write and maintain practical tutorials on Python, PHP, SQL, JavaScript, HTML, jQuery, and web development at plus2net. The tutorials focus on clear explanations, working examples, and code that readers can test and adapt while learning.


Subscribe to our YouTube Channel here

 Python Video Tutorials