Pandas Histograms: df.plot.hist() Frequency Distributions and Bins
Use DataFrame.plot.hist() (or df['column'].plot.hist()) to examine frequency distributions, identify data skewness, detect outliers, and discover clusters within continuous numeric datasets. Learn how to choose bin counts, overlay multiple series with alpha transparency, apply cumulative distributions, and save high-resolution chart images.
Create a basic histogram with bins 🔝
A histogram groups numeric values into continuous equal-width intervals called bins and counts how many observations fall into each bin. By default, Pandas uses 10 bins.
import pandas as pd
import matplotlib.pyplot as plt

my_dict = {
    "NAME": ["Ravi", "Raju", "Alex", "Ron", "Tor"],
    "MATH": [30, 40, 50, 30, 50]
}
df = pd.DataFrame(data=my_dict)
print(df)

# Plot histogram with 3 bins
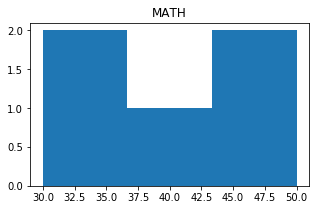
df["MATH"].plot.hist(bins=3, title="Math Score Distribution", figsize=(6, 3.5))
plt.tight_layout()
plt.show()
Expected console output:
   NAME  MATH
0  Ravi    30
1  Raju    40
2  Alex    50
3   Ron    30
4   Tor    50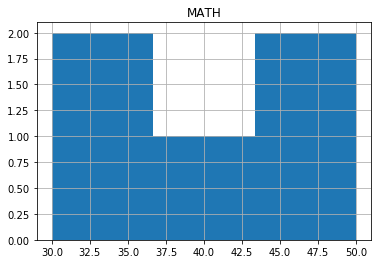
How to choose the number of bins 🔝
The choice of bin count determines how well the true distribution is revealed: too few bins oversmoothes the data into a single block, while too many bins leaves sparse gaps. In Pandas, you can pass an integer (e.g. bins=20) or an explicit list of bin edge boundaries (e.g. bins=[0, 35, 60, 80, 100]).
Overlay multiple numeric distributions with alpha 🔝
When comparing two columns on the same axis (such as Math marks vs Science marks), always set alpha=0.5 so overlapping bars do not occlude each other:
scores = pd.DataFrame({
    "Math": [30, 40, 50, 30, 50, 60, 70, 75],
    "Science": [55, 60, 65, 70, 75, 80, 85, 90]
})

scores.plot.hist(bins=5, alpha=0.5, figsize=(7, 4), title="Math vs Science Score Distribution")
plt.tight_layout()
plt.show()
Cumulative frequency distribution 🔝
Pass cumulative=True to draw a cumulative histogram, where each bin shows the running count of all observations less than or equal to that bin boundary:
scores["Math"].plot.hist(bins=5, cumulative=True, title="Cumulative Math Distribution", figsize=(6, 3.5), grid=True)
plt.tight_layout()
plt.show()
Configure gridlines, colors, and label rotation 🔝
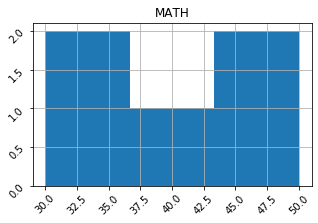
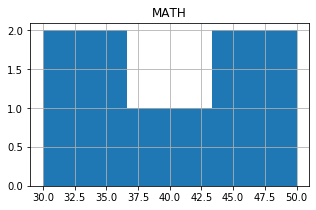
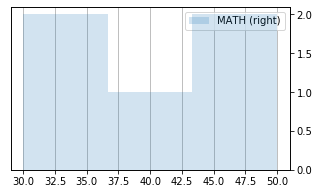
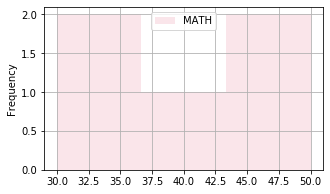
Customise appearance with grid=True, custom color tuples, and tick label rotation using rot=45 (or xrot=45 / yrot=45 in df.hist()):
Compare plot.hist() with df.hist() subplots 🔝
Pandas provides two convenient ways to create histograms:
df.plot.hist(): Overlays multiple numeric columns onto the same plot.df.hist(): Automatically generates a grid of separate subplots, giving each numeric column its own histogram panel.
# Generates separate subplots for each numeric column in the table
scores.hist(bins=5, figsize=(8, 3.5), grid=True)
plt.tight_layout()
plt.show()
Save histograms to file using savefig() 🔝
Save your histogram to high-resolution PNG or PDF before displaying or closing the figure buffer:
scores.plot.hist(bins=6, title="Score Distribution")
plt.tight_layout()
plt.savefig("score_histogram.png", dpi=300)
print("Saved chart as score_histogram.png")
plt.close()
Practical workflow: employee salary distribution analysis 🔝
Analyze company payroll distributions to examine compensation brackets, identify salary skewness, and validate totals with Python assertions.
import pandas as pd
import matplotlib.pyplot as plt

salary_data = pd.DataFrame({
    "Employee_ID": range(1, 11),
    "Salary": [45000, 52000, 48000, 75000, 62000, 58000, 89000, 64000, 71000, 95000]
})

# Assertions
assert len(salary_data) == 10
total_payroll = salary_data["Salary"].sum()
assert total_payroll == 659000
print("Total Payroll:", total_payroll)
print("Median Salary:", salary_data["Salary"].median())

ax = salary_data["Salary"].plot.hist(
    bins=5,
    figsize=(7, 4),
    color="darkcyan",
    edgecolor="white",
    grid=True,
    title="Employee Salary Distribution (5 Bins)"
)
ax.set_xlabel("Salary Bracket ($)")
ax.set_ylabel("Employee Count")
plt.tight_layout()
plt.show()
Expected console output:
Total Payroll: 659000
Median Salary: 63000.0
Exercise: customer age group distribution 🔝
Create a DataFrame representing 8 registered customers with ages: [22, 25, 29, 34, 38, 42, 46, 52]. Plot a histogram with 4 bins and an explicit edge color (edgecolor="black"), enable gridlines, title the plot "Customer Age Distribution", and calculate the mean customer age.
Exercise solution 🔝
import pandas as pd
import matplotlib.pyplot as plt

customers = pd.DataFrame({
    "Customer_ID": range(101, 109),
    "Age": [22, 25, 29, 34, 38, 42, 46, 52]
})

mean_age = customers["Age"].mean()
assert mean_age == 36.0
print("Average Customer Age:", mean_age)

ax = customers["Age"].plot.hist(
    bins=4,
    color="coral",
    edgecolor="black",
    grid=True,
    figsize=(6, 3.5),
    title="Customer Age Distribution"
)
ax.set_xlabel("Age")
ax.set_ylabel("Customer Count")
plt.tight_layout()
plt.show()
Expected console output:
Average Customer Age: 36.0Practice in Google Colab 🔝
Open in Google Colab View on GitHub
Run the histogram distribution examples interactively, experiment with custom bin counts and cumulative frequencies, and verify the practice exercise directly in Google Colab. All sample datasets are embedded directly in the notebook.
Further Reading & Related Tutorials 🔝
Continue exploring distribution analysis and related visualization techniques:
- Pandas Plot Overview — The full guide to Pandas charting formats and settings.
- Pandas Box Plots — Visualise medians, quartiles, and statistical outliers alongside histograms.
- Pandas Density Plots — Estimate probability density functions with smooth kernel density estimation (KDE).
- Pandas Bar Charts — Display category counts and discrete comparisons.
- Pandas Scatter Plots — Explore bivariate correlation between two continuous numeric variables.
- Pandas Plotting Exercises — Hands-on problem sets to test your visualization skills.
- SQL COUNT Queries — Group and count frequency occurrences inside database tables.
- Pandas Section Home — Master index of all Pandas pillars, tutorials, and workflows.
Reference: Pandas DataFrame.plot.hist official documentation.

Subhendu Mohapatra
Author & Instructor at plus2net
I write and maintain practical tutorials on Python, PHP, SQL, JavaScript, HTML, jQuery, and web development at plus2net. The tutorials focus on clear explanations, working examples, and code that readers can test and adapt while learning.


Subscribe to our YouTube Channel here

 Python Video Tutorials