Pandas DataFrame Exercise 1-1: Binning with cut() & Data Visualization
Advance your data processing and visual analytics capabilities. In this exercise, generate a synthetic multi-subject student score table with NumPy and Pandas, discretize continuous scores into grade tiers using pd.cut(), aggregate frequency distributions with groupby(), and plot scatter, pie, and bar charts.
Part 1: Generating Data & Binning with pd.cut() 🔝
Create a DataFrame with n=10 (or 25) students having sequential IDs and random scores between 0 and 100 across two subjects: MATH and ENG. Add a categorical result column my_result based on MATH scores categorized into four tiers:
[0, 40): Fail[40, 50): Third[50, 75): Second[75, 100]: First
import numpy as np
import pandas as pd

np.random.seed(42)
n = 25  # Number of students

df = pd.DataFrame({
    "ID": np.arange(1, n + 1),
    "MATH": np.random.randint(0, 100, size=n),
    "ENG": np.random.randint(0, 100, size=n)
})

grade_labels = ["Fail", "Third", "Second", "First"]
df["my_result"] = pd.cut(
    x=df["MATH"],
    bins=[0, 40, 50, 75, 101],
    labels=grade_labels,
    right=False
)
print(df.head())
Part 2: Grouping & Data Visualization 🔝
Once continuous data is binned into categories, calculate the frequency distribution across grades using groupby() and visualize the distribution:
import matplotlib.pyplot as plt

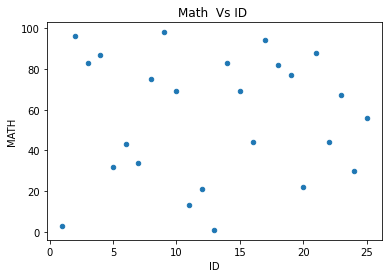
# 1. Scatter Plot: Score distribution across student IDs
df.plot.scatter(x="ID", y="MATH", title="Math Scores vs Student ID", grid=True)
plt.show()

# 2. Group distribution
result_counts = df.groupby("my_result", observed=False)[["ID"]].count()
result_counts.columns = ["Count"]
print("Result Summary:
", result_counts)

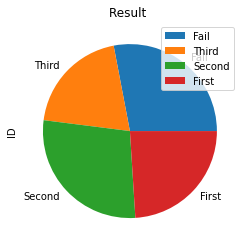
# 3. Pie Chart
result_counts.plot.pie(y="Count", title="Grade Distribution", figsize=(5, 5), autopct="%1.1f%%")
plt.show()

# 4. Bar Chart
result_counts.plot.bar(y="Count", title="Grade Counts", figsize=(6, 4), color="#007bff", grid=True)
plt.show()
Rendered Plots: Scatter, Pie, and Bar Charts 🔝
Below are the resulting visual plots produced by Pandas and Matplotlib:
Scatter Plot (Math vs ID)
Pie Chart (Class Grade Distribution)
Bar Chart (Class Grade Frequencies)

Complete Verified Code & Assertions 🔝
assert len(df) == 25
assert result_counts["Count"].sum() == 25
assert set(df["my_result"].dropna().unique()).issubset(set(grade_labels))
print("All Exercise 1-1 data assertions passed!")
Exercise Series Navigation 🔝
- Exercise 1: Basic student dataset queries, marks, and unique values.
- Exercise 1-1 (Current Page): Data binning with cut(), groupby distributions, and charts.
- Exercise 2: Search Console query analytics, string length, and click analysis.
- Exercise 3 Series: Time-series maintenance logs and datetime queries.
Practice in Google Colab & GitHub 🔝
Open in Google Colab View on GitHub
Run score generation, binning, and plot creation interactively in Google Colab.
More Details & Related Tutorials 🔝
- pd.cut() — Segmenting and sorting continuous numeric values into bins.
- groupby() — Split-apply-combine aggregations and transformations.
- Scatter Plots — Bivariate relationships and point clusters.
- Pie Charts — Proportional breakdowns of categorical data.
- Bar Charts — Categorical frequency comparisons and styling.
- Plotting Overview — Master guide to Pandas visualization tools.

Subhendu Mohapatra
Author & Instructor at plus2net
I write and maintain practical tutorials on Python, PHP, SQL, JavaScript, HTML, jQuery, and web development at plus2net. The tutorials focus on clear explanations, working examples, and code that readers can test and adapt while learning.


Subscribe to our YouTube Channel here

 Python Video Tutorials