openpyxl: Styles & Formatting (Beginner Guide)
How to Style and Format Excel Files in Python Using openpyxl
This beginner-friendly guide shows how to style Excel files using openpyxl:
fonts, fills, alignment, borders, column width, row height, number formats (date, currency, percentage), and conditional formatting (ColorScale, DataBar).
Setup
from openpyxl import Workbook
wb = Workbook()  # create workbook
ws = wb.active  # default worksheet
Fonts & Fills
from openpyxl.styles import Font, PatternFill

ws['A1'] = "Report"
ws['A1'].font = Font(size=16, bold=True)
ws['A1'].fill = PatternFill("solid", start_color="FFFDE7")
Alignment & Wrap Text
from openpyxl.styles import Alignment

ws['B2'] = "Long text that should wrap within the cell"
ws['B2'].alignment = Alignment(horizontal="center", vertical="center", wrap_text=True)

ws.row_dimensions[2].height = 40
ws.column_dimensions['B'].width = 35
b) Align a single cell (center + wrap)
from openpyxl import Workbook
from openpyxl.styles import Alignment

wb = Workbook()
ws = wb.active

ws['B2'] = "Centered and wrapped text"
ws['B2'].alignment = Alignment(
    horizontal='center',
    vertical='center',
    wrap_text=True
)

# Optional: adjust width/height so wrapping looks good
ws.column_dimensions['B'].width = 30
ws.row_dimensions[2].height = 28

wb.save('D:\\openpyxl_align_cell.xlsx')
c) Align an entire row (header row centered)
from openpyxl import Workbook
from openpyxl.styles import Alignment

wb = Workbook()
ws = wb.active

ws.append(['ID','Name','Score'])
ws.append([101,'Alex',88])

center = Alignment(horizontal='center')

# Apply to first row (A1:C1)
for cell in ws['1:1']:
    cell.alignment = center

wb.save('D:\\openpyxl_align_row.xlsx')
d) Align an entire column (center all values in column B)
from openpyxl import Workbook
from openpyxl.styles import Alignment

wb = Workbook()
ws = wb.active

ws.append(['ID','Name','Score'])
ws.append([1,'Alex',88])
ws.append([2,'Ron',91])

center = Alignment(horizontal='center')

# Column B is the 2nd column
for r in range(1, ws.max_row+1):
    ws.cell(row=r, column=2).alignment = center

wb.save('D:\\openpyxl_align_column.xlsx')ws.column_dimensions['B'].width = 22
ws.row_dimensions[1].height = 22Borders
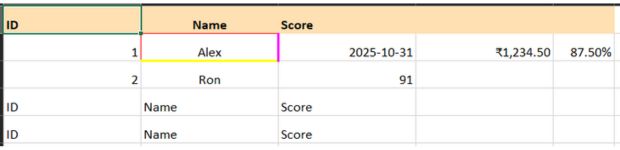
from openpyxl.styles import Border, Side

thin = Side(style="thin", color="000000")
ws['A1'].border = Border(left=thin, right=thin, top=thin, bottom=thin)
from openpyxl.styles import Border, Side
thick = Side(style="thick", color="FF00FF")
ws['A1'].border = Border(
left=thin,
right=thick,
top=thin,
bottom=thick
)
thick2 = Side(style="thick", color="FFFF00")
ws['B2'].border = Border(
left=thin,
right=thick,
top=thin,
bottom=thick2
)
my_path = 'openpyxl_styles_demo.xlsx' # Path
wb.save(my_path)Column Width & Row Height (Batch)
cols = ['A','B','C','D']
for c in cols:
    ws.column_dimensions[c].width = 20

for r in range(1,6):
    ws.row_dimensions[r].height = 22
Number Formats (Date, Currency, Percentage)
from datetime import datetime

ws['C2'] = datetime(2025,10,31)
ws['C2'].number_format = "yyyy-mm-dd"

ws['D2'] = 1234.5
ws['D2'].number_format = '"₹"#,##0.00'  # INR

ws['E2'] = 0.875
ws['E2'].number_format = "0.00%"
Quick Header Styling (Loop)
headers = ["ID","Name","Score"]
ws.append(headers)

from openpyxl.styles import Font, PatternFill
for cell in ws["1:1"]:
    cell.font = Font(bold=True)
    cell.fill = PatternFill("solid", start_color="FFE0B2")
Conditional Formatting (ColorScale & DataBar)
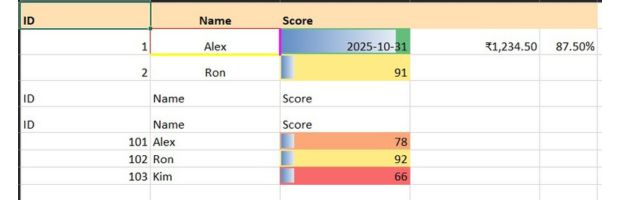
Add a few sample rows and then apply conditional formatting to the Score column.
ws.append([101, "Alex", 78])
ws.append([102, "Ron", 92])
ws.append([103, "Kim", 66])
from openpyxl.formatting.rule import ColorScaleRule, DataBarRule
# Color scale on scores (column C)
ws.conditional_formatting.add(
"C2:C100",
ColorScaleRule(
start_type="min", start_color="F8696B",
mid_type="percentile", mid_value=50, mid_color="FFEB84",
end_type="max", end_color="63BE7B"
)
)
# Data bar on scores
ws.conditional_formatting.add(
"C2:C100",
DataBarRule(start_type="min", end_type="max", color="638EC6")
)Save the workbook
my_path = 'D:\\openpyxl_styles_demo.xlsx'  # Path
wb.save(my_path)
Download the above full source code from Github or run the code in your Google colab platform.
OpenPyxl Styles and formatting
https://github.com/plus2net/Python-basics/blob/main/openpyxl_4_styles_formatting.ipynb
OpenPyxl Styles and formatting
https://github.com/plus2net/Python-basics/blob/main/openpyxl_4_styles_formatting.ipynb
openpyxl Library Formulas Reading Excel with openpyxl Managing Worksheets Database to Excel
XlsxWriter library Pandas DataFrame to Excel

Subhendu Mohapatra
Author & Instructor at plus2net
I write and maintain practical tutorials on Python, PHP, SQL, JavaScript, HTML, jQuery, and web development at plus2net. The tutorials focus on clear explanations, working examples, and code that readers can test and adapt while learning.
Connect:


Subscribe to our YouTube Channel here
This article is written by plus2net.com team.
https://www.plus2net.com

 Python Video Tutorials